3.3. Conformal Prediction
Conformal prediction takes a route opposite to that of the other methods in
this part. Rather than trying to describe the predictive distribution more
faithfully, it gives up on the distribution and returns a set of
outcomes instead, a set of labels in classification or an interval
in regression, equipped with a finite-sample coverage guarantee. More
specifically, if the calibration and test data are exchangeable, the true
outcome lies in the returned set with probability at least 1 - alpha,
however good or bad the underlying model may be
[AB21].
All variants on this page share the same mechanism, which consists of three
steps. First, a non-conformity score s(x, y) measures how poorly a
candidate outcome y conforms to the model’s prediction for x. Second,
this score is evaluated on a held-out calibration split, and its empirical
1 - alpha quantile, corrected slightly upward for the finite sample size,
is stored. Third, at prediction time, the set comprises every candidate whose
score does not exceed this quantile. In probly, the second step is carried out
by probly.calibrator.calibrate(), which must be applied to data disjoint
from the training data before the wrapper can predict.
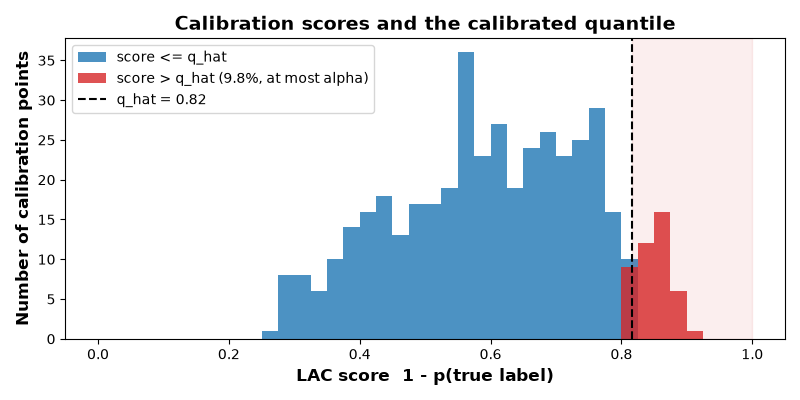
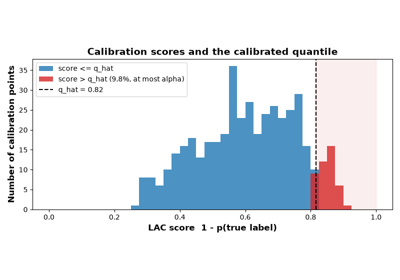
The figure below, taken from
A Gentle Introduction to Conformal Prediction, shows
the second step for a random forest on noisy handwritten digits with
alpha = 0.1. The histogram collects the scores 1 - p_y of the true
labels on the calibration split, and the dashed line marks the calibrated
quantile q_hat. About 10% of the calibration scores lie to its right; at
prediction time, a label enters the set if its score falls to the left.
Since none of these steps depends on what the score measures, the guarantee holds for every choice of score, and the design effort shifts entirely to the score itself. The score does not affect whether coverage holds, only how large the sets are and how well their size adapts to the difficulty of the input; it is along this axis that the variants below differ.
Important
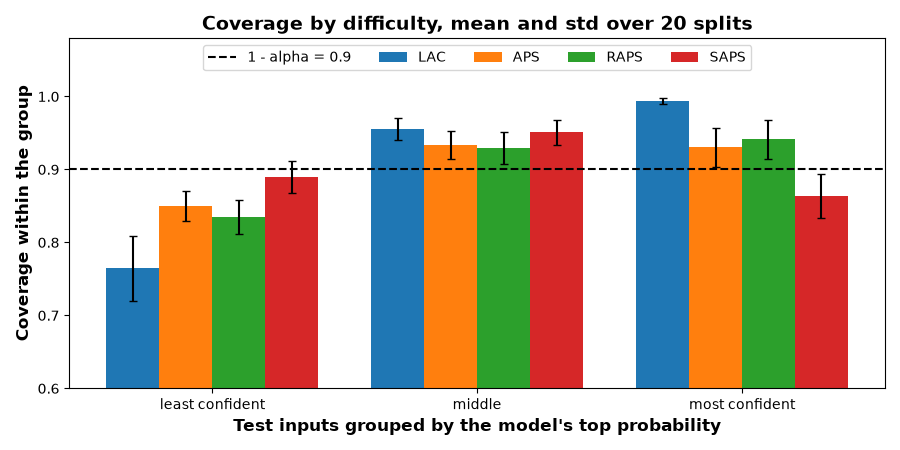
Coverage is marginal, i.e., it holds on average over the distribution of inputs, not conditionally on a particular input. A predictor may thus achieve 90% coverage overall while systematically undercovering a difficult subgroup. Adaptive scores can narrow this gap, but none of them closes it; without further assumptions, exact conditional coverage is in general unattainable.
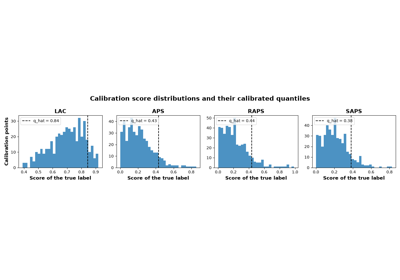
The figure below, taken from How Conformal Sets Change with the Score and with Alpha, makes the distinction concrete. The test inputs are grouped into thirds by the model’s top probability, and the coverage is measured within each group. All four classification scores reach 90% overall, but LAC covers the least confident third only about three times in four and the most confident third almost always. The adaptive scores spread the coverage more evenly, yet none of them reaches 90% in every group.
3.3.1. Classification
In classification, the prediction is a set of labels, and the scores differ
essentially in how much probability mass they require before they stop adding
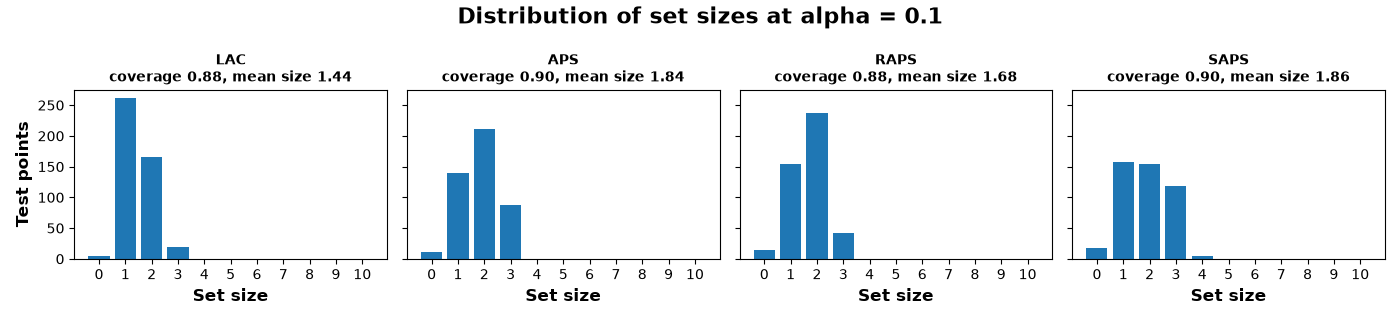
classes. The figure below, from the same example, shows the resulting set
sizes at alpha = 0.1: at the same coverage, LAC mostly returns one or two
labels, whereas the adaptive scores return two or three labels more often.
3.3.1.1. conformal_lac
Least ambiguous set-valued classifier. The score is simply 1 - p_y, so
a label enters the set if the model assigns it sufficient probability. Since
this threshold on p_y is the same for every input, the resulting sets are
small on average, but the coverage target is met partly by overcovering easy
inputs and undercovering difficult ones.
- Idea:
Non-conformity score
1 - p_y; a label is retained if it receives enough probability.- Representation:
A set of labels with marginal coverage.
- Advantages:
Typically the smallest average sets of all scores on this page, which is why it is the default.
- Disadvantages:
Little adaptivity; the marginal target is met partly by undercovering hard inputs and overcovering easy ones.
- Reference:
[AB21]
How Conformal Sets Change with the Score and with Alpha
3.3.1.2. conformal_aps
Adaptive prediction sets. The classes are sorted by predicted probability, and the score of a label is the cumulative probability mass up to and including it, with a uniform random term that removes the discreteness of the last step. As a result, the set grows when the predicted distribution is flat and shrinks when it is peaked.
- Idea:
Accumulate the sorted class probabilities; the score of a label is the cumulative mass up to it, with a random tie-break.
- Representation:
A set of labels with marginal coverage.
- Advantages:
Sets grow when the distribution is flat and shrink when it is peaked, which yields noticeably better conditional coverage than LAC.
- Disadvantages:
On many-class problems, the long tail of small probabilities can inflate the sets considerably.
- Reference:
[AB21]
How Conformal Sets Change with the Score and with Alpha
3.3.1.3. conformal_saps
Sorted adaptive prediction sets. Only the top-1 probability is treated as
reliable information; the rest of the tail is replaced by a penalty that is
linear in the rank and weighted by lambda_val. The premise is that the tail
probabilities of a many-class classifier are largely noise, so that their
order carries information while their values do not.
- Idea:
Keep only the top-1 probability and replace the tail by a penalty linear in the rank, weighted by
lambda_val.- Representation:
A set of labels with marginal coverage.
- Advantages:
Retains most of the adaptivity of APS while avoiding the large sets caused by the noisy tail.
- Disadvantages:
Adds the hyperparameter
lambda_val, and relies on the order of the tail being reliable.- Reference:
[AB21]
How Conformal Sets Change with the Score and with Alpha
3.3.1.4. conformal_raps
Regularized adaptive prediction sets. APS with an explicit penalty
lambda_reg on every class included beyond rank k_reg. The diagnosis is
the same as for SAPS, namely that the tail is what inflates the sets, but the
remedy is more conservative: the tail probabilities are kept, and only the
cost of reaching into the tail increases.
- Idea:
APS with an explicit penalty
lambda_regon every class included beyond rankk_reg.- Representation:
A set of labels with marginal coverage.
- Advantages:
Directly addresses the long tail of APS, yielding small sets without giving up adaptivity.
- Disadvantages:
Two hyperparameters,
lambda_regandk_reg, to both of which the set sizes are sensitive.- Reference:
[AB21]
How Conformal Sets Change with the Score and with Alpha
3.3.2. Regression
In regression, the prediction is an interval, and the main question is whether
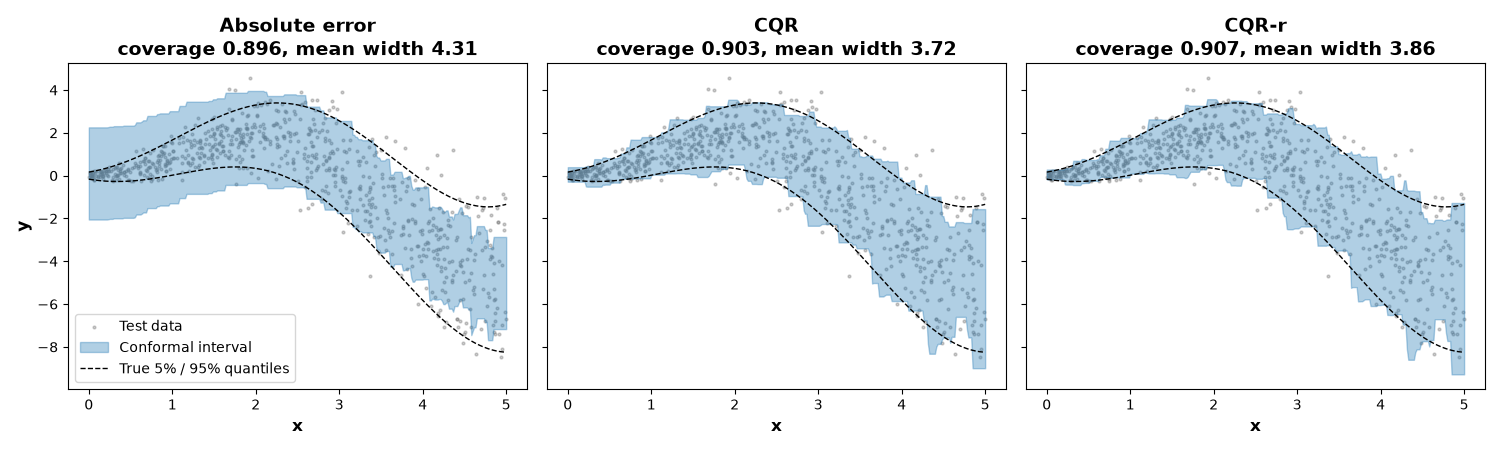
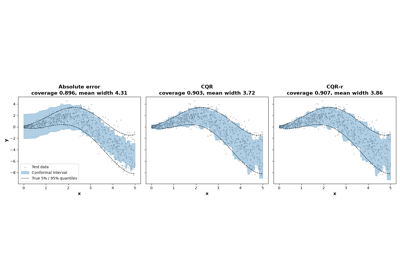
its width may vary with the input. The figure below, taken from
Adaptive Conformal Intervals on Heteroscedastic Data,
compares three of the scores on synthetic data whose noise grows with x.
All three intervals reach about 90% coverage, but only the two CQR variants
follow the true conditional quantiles (dashed); the absolute-error interval is
too wide where the noise is small and too narrow where it is large.
3.3.2.1. conformal_absolute_error
Absolute residual. With the score |y - y_hat|, the calibrated quantile
is simply added to and subtracted from the point prediction, so the interval
has the same width for every input.
- Idea:
Score
|y - y_hat|; add and subtract the calibrated quantile around the point prediction.- Representation:
An interval with marginal coverage.
- Advantages:
The simplest conformal regressor, and a natural first choice.
- Disadvantages:
Constant width everywhere: valid on average, but insensitive to the fact that some inputs are harder to predict than others.
- Reference:
[AB21]
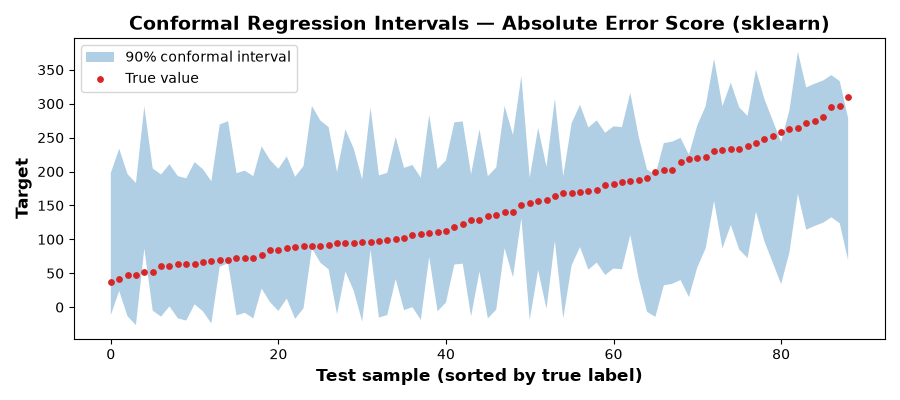
The figure below, taken from
Regression Conformal Prediction — sklearn, shows the
resulting intervals for a random forest on the Diabetes data, with the test
points sorted by their true value. The bands only appear to vary because they
are centered on point predictions that do; their width is the same for every
input. About 95% of the true values fall inside, as calibrated for
alpha = 0.05, but the intervals are as wide for the points that the model
predicts well as for those it predicts poorly.
Adaptive Conformal Intervals on Heteroscedastic Data
3.3.2.2. conformal_cqr
Conformalized quantile regression. The base model predicts a lower and an
upper quantile, and the score max(q_lo - y, y - q_hi) measures how far the
true value falls outside the predicted interval, with negative values
indicating that it falls inside. The calibrated quantile then shifts both
endpoints outward, or inward, by the same constant.
- Idea:
Shift the endpoints of a predicted quantile interval by a calibrated constant, using the score
max(q_lo - y, y - q_hi).- Representation:
An interval with marginal coverage.
- Advantages:
The width varies with the input because the base model lets it vary; conformalization only corrects the coverage level.
- Disadvantages:
Requires a quantile-regression base model, and an additive correction cannot rescale an interval whose width is off by a factor.
- Reference:
[AB21]
Adaptive Conformal Intervals on Heteroscedastic Data
Quantile Regression Conformal Prediction — sklearn
Quantile Regression Conformal Prediction — PyTorch
3.3.2.3. conformal_cqr_r
Normalized CQR. The CQR score is divided by the width of the predicted interval, so that the correction becomes multiplicative rather than additive. The difference matters because an additive correction widens every interval by the same amount, whereas a multiplicative one widens each interval in proportion to its predicted width. A multiplicative correction is therefore the appropriate one for a base model whose intervals have the right shape but the wrong overall scale.
- Idea:
Divide the CQR score by the predicted interval width, which makes the correction multiplicative.
- Representation:
An interval with marginal coverage.
- Advantages:
Rewards a base model that signals where it is unsure; preferable to plain CQR when the predicted intervals are right in shape but wrong in scale.
- Disadvantages:
Still requires a quantile-regression base model, and degrades when the predicted widths are unreliable.
- Reference:
[AB21]
Adaptive Conformal Intervals on Heteroscedastic Data
Quantile Regression Conformal Prediction — sklearn
Quantile Regression Conformal Prediction — PyTorch
3.3.2.4. conformal_uacqr
Uncertainty-aware CQR. Here, the base model is an ensemble of quantile regressors, and the CQR score is normalized by the ensemble’s standard deviation at each endpoint. Since this standard deviation reflects disagreement among the members rather than noise in the target, the intervals widen where the model is uncertain about the quantiles themselves, which one may interpret as an epistemic component of the interval width.
- Idea:
Normalize the CQR score by the standard deviation of an ensemble of quantile regressors at each endpoint.
- Representation:
An interval with marginal coverage.
- Advantages:
The scaling factor can be read as epistemic: the interval widens where the members disagree about the quantiles, not merely where the target is noisy.
- Disadvantages:
The most expensive option on this page, since it requires training an ensemble.
- Reference:
[AB21]
Adaptive Conformal Intervals on Heteroscedastic Data
Quantile Regression Conformal Prediction — PyTorch
3.3.3. Choosing a Score
For classification, conformal_lac() is the natural choice when the
average set size matters most. When conditional coverage matters as well, the
adaptive scores are preferable: conformal_aps() distributes the coverage
most evenly but produces the largest sets, whereas conformal_raps() and
conformal_saps() give up some of this evenness in exchange for smaller
sets. For regression, conformal_absolute_error() is the default unless
the base model can predict quantiles, in which case conformal_cqr_r() is
usually preferable.
Whichever score is chosen, coverage alone says little about its quality,
since it is guaranteed by construction. What separates the scores is the set
size at the target coverage, together with how evenly the coverage is
distributed across inputs, and the two should be evaluated jointly.
How Conformal Sets Change with the Score and with Alpha
carries out this comparison for the classification scores, including how the
sets grow as alpha shrinks, and
Adaptive Conformal Intervals on Heteroscedastic Data
does the same for the regression scores, with coverage and interval width
along the input.
The same calibration machinery can also be applied to distributions instead of labels, which leads to the conformal credal sets.
3.3.4. Full API
Create a LAC conformal predictor wrapper. |
|
Create an APS conformal predictor wrapper. |
|
Create a SAPS conformal predictor wrapper. |
|
Create a RAPS conformal predictor wrapper. |
|
Create an absolute-error conformal predictor wrapper. |
|
Create a CQR conformal predictor wrapper. |
|
Create a CQR-r conformal predictor wrapper. |
|
Create a UACQR conformal predictor wrapper. |