Note
Go to the end to download the full example code.
Sets of outcomes
A set-valued prediction does not weigh the outcomes against each other; it merely states
which of them remain in play. Conformal prediction produces such sets, and probly
stores them as a
OneHotConformalSet for
classification and as an
IntervalConformalSet for
regression.
The uncertainty is expressed by the size of the set, that is, by the number of labels, or the width of the interval, needed to reach the coverage level fixed in the calibration step. In this sense, a set is closer to a decision than to a description of the odds.
from __future__ import annotations

import matplotlib.pyplot as plt
import numpy as np

from probly.plot import PlotConfig
from probly.representation.conformal_set import (
    IntervalConformalSet,
    OneHotConformalSet,
    create_interval_conformal_set,
    create_onehot_conformal_set,
)

CLASSES = ["cat", "dog", "fox"]
config = PlotConfig()

# The scores the sets are built from, one first-order distribution per input.
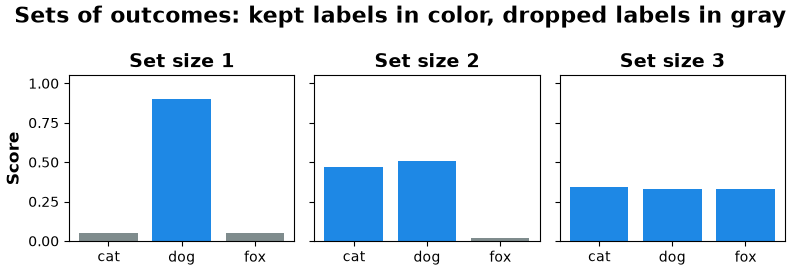
scores = np.array([[0.05, 0.90, 0.05], [0.47, 0.51, 0.02], [0.34, 0.33, 0.33]])

# Every label whose score reaches the threshold is kept. In practice, the threshold is a
# quantile of nonconformity scores on a held-out calibration split; here it is set by hand.
# Shape: (instances, classes)
threshold = 0.3
conformal_set: OneHotConformalSet = create_onehot_conformal_set(scores >= threshold)

print("Set membership:\n", conformal_set.array)
print("Set sizes:", conformal_set.set_size)
Set membership:
 [[False  True False]
 [ True  True False]
 [ True  True  True]]
Set sizes: [1 2 3]
Note that the set attaches no probabilities to the labels it keeps: inside the set, every label is simply in play. The scores are drawn underneath only to indicate what the set was built from; they are not part of the representation.
fig, axes = plt.subplots(1, 3, figsize=(8, 2.8), sharey=True)
for index, ax in enumerate(axes):
    colors = [config.categorical_palette[0] if kept else config.color_neutral for kept in conformal_set.array[index]]
    ax.bar(CLASSES, scores[index], color=colors)
    ax.set_ylim(0, 1.05)
    ax.set_title(f"Set size {conformal_set.set_size[index]}")
axes[0].set_ylabel("Score")
fig.suptitle("Sets of outcomes: kept labels in color, dropped labels in gray")
fig.tight_layout()
plt.show()
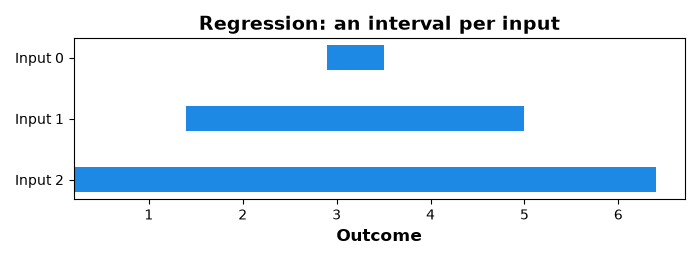
For regression, the set is an interval, and its size is the interval’s width.
interval_set: IntervalConformalSet = create_interval_conformal_set(
    np.array([2.9, 1.4, 0.2]),
    np.array([3.5, 5.0, 6.4]),
)
print("Interval bounds:\n", interval_set.array)
print("Interval widths:", interval_set.set_size)

fig, ax = plt.subplots(figsize=(7, 2.6))
lower, upper = interval_set.array[:, 0], interval_set.array[:, 1]
positions = np.arange(len(lower))
ax.barh(
    positions,
    upper - lower,
    left=lower,
    height=0.4,
    color=config.categorical_palette[0],
)
ax.set_yticks(positions, [f"Input {index}" for index in positions])
ax.set_xlabel("Outcome")
ax.set_title("Regression: an interval per input")
ax.invert_yaxis()
fig.tight_layout()
plt.show()
Interval bounds:
 [[2.9 3.5]
 [1.4 5. ]
 [0.2 6.4]]
Interval widths: [0.6 3.6 6.2]
A set of outcomes is silent about the source of its size: a set may be wide because the outcome is inherently noisy or because the model lacks knowledge, and the representation does not distinguish the two. What it offers instead is a coverage guarantee that holds regardless of the underlying model, provided that calibration and test data are exchangeable. This guarantee is, however, marginal: it holds on average over inputs, not conditionally on the particular input at hand.
Total running time of the script: (0 minutes 0.238 seconds)