Note
Go to the end to download the full example code.
Second order: a sample of distributions
Roughly speaking, a second-order representation is a distribution over first-order
distributions: rather than committing to one set of odds, it expresses how uncertain the
odds themselves are. The sampled encoding approximates this object by a finite collection
of first-order distributions, obtained, for instance, from the members of an ensemble,
from repeated dropout passes, or from samples of a posterior over the weights. In
probly, such a collection is a
CategoricalDistributionSample.
The two inputs below have the same mean prediction, which is all a first-order representation would report. They differ in how far their members lie apart, and it is this dispersion that is commonly read as the epistemic part of the uncertainty: tightly clustered members suggest that the odds are pinned down, scattered members that the model does not know them.
from __future__ import annotations

import matplotlib.pyplot as plt
import numpy as np

from probly.plot import PlotConfig
from probly.representation.distribution import CategoricalDistributionSample, create_categorical_distribution
from probly.representation.sample import create_sample

CLASSES = ["cat", "dog", "fox"]
config = PlotConfig()
rng = np.random.default_rng(0)

# Ten members per input, for two inputs. Shape: (members, instances, classes)
# The members are drawn in mirrored pairs around a shared center, so both inputs have
# exactly the same mean prediction. The offsets sum to zero over the classes and are
# bounded by the smallest center entry, which keeps every member on the simplex.
center = np.array([0.45, 0.35, 0.20])
spread = np.array([0.01, 0.19])  # input 0 agrees, input 1 does not
noise = rng.normal(size=(5, 2, 3))
noise -= noise.mean(axis=-1, keepdims=True)
noise /= np.abs(noise).max(axis=(0, 2), keepdims=True)
offsets = spread[None, :, None] * noise
members = center + np.concatenate([offsets, -offsets])

sample: CategoricalDistributionSample = create_sample(
    [create_categorical_distribution(member) for member in members],
    sample_axis=0,
)

print("Number of members:", sample.sample_size)
print("Mean prediction:\n", sample.sample_mean().probabilities)
print("Spread between members (per class):\n", members.std(axis=0))
Number of members: 10
Mean prediction:
 [[0.45 0.35 0.2 ]
 [0.45 0.35 0.2 ]]
Spread between members (per class):
 [[0.00571341 0.00485909 0.00600654]
 [0.11209145 0.09536597 0.08336335]]
A distribution over three classes is a point in a triangle, the probability simplex, whose corners are the three distributions that put all mass on a single class. Each member is therefore one point, and the dispersion of the sample becomes visible as the scatter of these points.
def to_cartesian(probabilities: np.ndarray) -> tuple[np.ndarray, np.ndarray]:
    """Map distributions over three classes to 2D plot coordinates."""
    x = probabilities[..., 1] + 0.5 * probabilities[..., 2]
    y = (np.sqrt(3) / 2) * probabilities[..., 2]
    return x, y


def draw_simplex(ax: plt.Axes) -> None:
    """Draw the triangle outline and label its corners with the class names."""
    corners = np.eye(3)
    corner_x, corner_y = to_cartesian(corners)
    ax.plot([*corner_x, corner_x[0]], [*corner_y, corner_y[0]], color=config.color_neutral, lw=1)
    for name, x, y in zip(CLASSES, corner_x, corner_y, strict=True):
        ax.annotate(name, (x, y), ha="center", va="center", xytext=(0, 12 if y > 0 else -12), textcoords="offset points")
    ax.set_xlim(-0.15, 1.15)
    ax.set_ylim(-0.15, 1.05)
    ax.set_aspect("equal")
    ax.axis("off")


fig, axes = plt.subplots(1, 2, figsize=(7.5, 4))
titles = ["Input 0: members agree", "Input 1: members disagree"]
for index, (ax, title) in enumerate(zip(axes, titles, strict=True)):
    draw_simplex(ax)
    member_x, member_y = to_cartesian(members[:, index, :])
    ax.scatter(member_x, member_y, color=config.categorical_palette[0], s=28, zorder=3, label="member")
    mean_x, mean_y = to_cartesian(sample.sample_mean().probabilities[index])
    ax.scatter(mean_x, mean_y, color=config.color_positive, s=70, marker="X", zorder=4, label="mean")
    ax.set_title(title)
axes[0].legend(loc="upper left", frameon=False, fontsize=9)
fig.suptitle("Second order, sampled: ten distributions on the simplex")
fig.tight_layout()
plt.show()
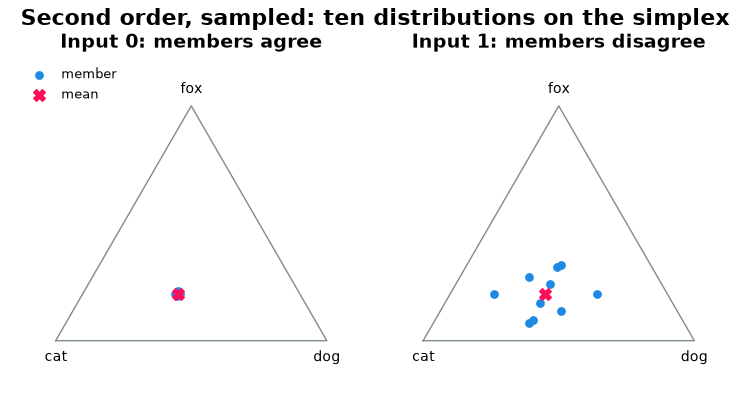
Since the mean predictions coincide, a first-order representation would report the same for both inputs; the dispersion of the members is the information the second-order representation adds. Two caveats apply. First, the members are a finite sample, so every measure computed from them is an estimate whose value depends on the number of members. Second, the dispersion is only as informative as the diversity of the members: members trained in the same way on the same data may agree for reasons that have little to do with the input, in which case a small spread need not mean that the odds are pinned down.
Total running time of the script: (0 minutes 0.087 seconds)