Note
Go to the end to download the full example code.
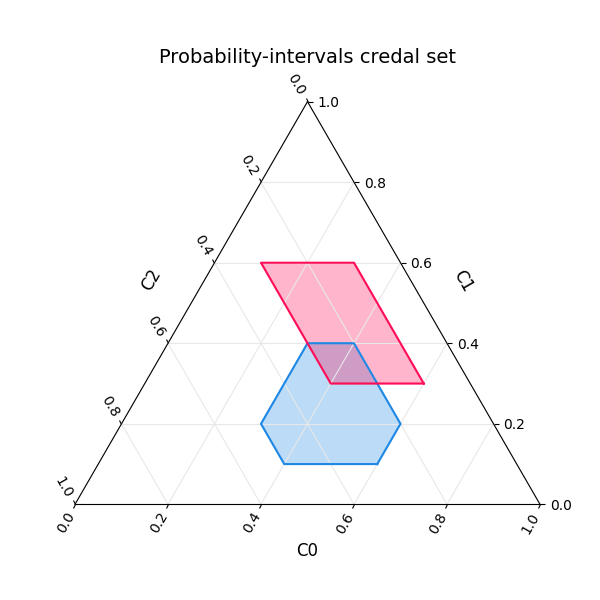
Probability-intervals credal set
An ArrayProbabilityIntervalsCredalSet
specifies independent lower and upper bounds on the probability of each
class. The credal set contains every distribution that satisfies all bounds
simultaneously (and sums to one).
This is one of the most intuitive representations: each class gets its own interval, and you can inspect the width of each interval to gauge per-class uncertainty.
from __future__ import annotations

import matplotlib.pyplot as plt
import numpy as np

from probly.plot import plot_credal_set
from probly.representation.credal_set.array import ArrayProbabilityIntervalsCredalSet

# 2 instances over 3 classes.
intervals = ArrayProbabilityIntervalsCredalSet(
    lower_bounds=np.array(
        [
            [0.1, 0.2, 0.3],
            [0.3, 0.1, 0.1],
        ]
    ),
    upper_bounds=np.array(
        [
            [0.4, 0.5, 0.6],
            [0.6, 0.3, 0.7],
        ]
    ),
)

print("Shape (batch dims):", intervals.shape)
print("Lower bounds:\n", intervals.lower())
print("Upper bounds:\n", intervals.upper())
print("Interval widths:\n", intervals.width())

# Check whether a specific distribution falls within the intervals.
candidate = np.array([0.3, 0.3, 0.4])
print("Candidate:", candidate)
print("Contained in intervals:", intervals.contains(candidate))
Shape (batch dims): (2,)
Lower bounds:
 [[0.1 0.2 0.3]
 [0.3 0.1 0.1]]
Upper bounds:
 [[0.4 0.5 0.6]
 [0.6 0.3 0.7]]
Interval widths:
 [[0.3 0.3 0.3]
 [0.3 0.2 0.6]]
Candidate: [0.3 0.3 0.4]
Contained in intervals: [ True  True]
On the simplex the feasible region is drawn as a filled polygon derived from the per-class bounds.
Total running time of the script: (0 minutes 0.288 seconds)