Note
Go to the end to download the full example code.
Plotting binary credal sets on an interval
The plot_credal_set() function also supports 2-class
(binary) credal sets. Instead of a ternary simplex the plot renders a
horizontal interval on [0, 1] representing P(class 2), with a shaded band
showing the credal set and scatter markers at each member distribution.
The same credal set types are supported:
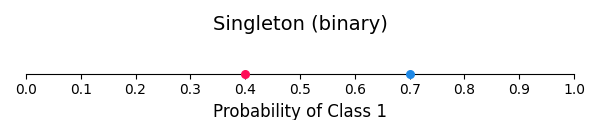
Singleton – a single point on the line.
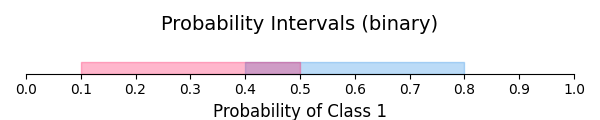
Probability intervals – a shaded band between the lower and upper bounds.
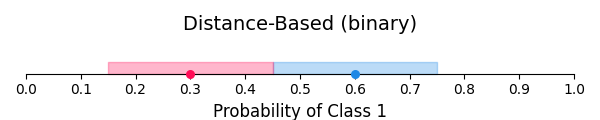
Distance-based – a shaded band plus a marker at the nominal distribution.
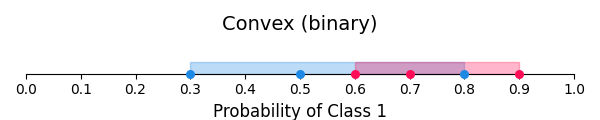
Convex / Discrete – a shaded band from the minimum to the maximum member probability, with scatter markers for every vertex.
Each batch element is drawn in a distinct colour.
from __future__ import annotations

import matplotlib.pyplot as plt
import numpy as np

from probly.plot import PlotConfig, plot_credal_set
from probly.representation.credal_set.array import (
    ArrayConvexCredalSet,
    ArrayDiscreteCredalSet,
    ArrayDistanceBasedCredalSet,
    ArrayProbabilityIntervalsCredalSet,
    ArraySingletonCredalSet,
)
Singleton credal set
A single probability distribution per instance, shown as a point on the line.
singleton = ArraySingletonCredalSet(
    array=np.array([[0.3, 0.7], [0.6, 0.4]]),
)
plot_credal_set(singleton, title="Singleton (binary)")
plt.show()
Probability intervals
Per-class lower and upper bounds define a feasible interval on the line.
Distance-based credal set
A nominal distribution and a radius. The shaded band covers all distributions within total-variation distance; the marker shows the nominal.
distance_based = ArrayDistanceBasedCredalSet(
    nominal=np.array([[0.4, 0.6], [0.7, 0.3]]),
    radius=np.array([0.15, 0.15]),
)
plot_credal_set(distance_based, title="Distance-Based (binary)")
plt.show()
Convex credal set
Explicit vertex distributions. The band spans from the minimum to the maximum P(class 2) across vertices, with markers at each vertex.
convex = ArrayConvexCredalSet(
    array=np.array(
        [
            [[0.7, 0.3], [0.2, 0.8], [0.5, 0.5]],
            [[0.4, 0.6], [0.1, 0.9], [0.3, 0.7]],
        ]
    ),
)
plot_credal_set(convex, title="Convex (binary)")
plt.show()
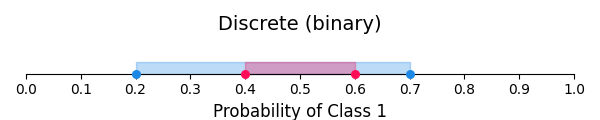
Discrete credal set
Like the convex case but represents a finite set of distributions rather than their convex hull.
discrete = ArrayDiscreteCredalSet(
    array=np.array(
        [
            [[0.8, 0.2], [0.3, 0.7]],
            [[0.6, 0.4], [0.4, 0.6]],
        ]
    ),
)
plot_credal_set(discrete, title="Discrete (binary)")
plt.show()
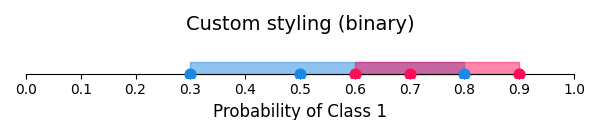
Custom labels and configuration
Pass class labels and a PlotConfig to customise the
appearance.
Total running time of the script: (0 minutes 0.307 seconds)