Note
Go to the end to download the full example code.
Plotting credal sets on the simplex
The plot_credal_set() function visualises 3-class credal
sets on a ternary simplex. It automatically picks the right renderer for each
credal set type:
ArraySingletonCredalSet– a single point per instance.ArrayProbabilityIntervalsCredalSet– a filled feasibility polygon derived from per-class lower/upper bounds.ArrayDistanceBasedCredalSet– the same polygon style, plus a marker at the nominal distribution.ArrayConvexCredalSet/ArrayDiscreteCredalSet– the convex hull of the member distributions, with scatter markers at each vertex.
Each batch element is drawn in a distinct colour so that multiple sets can be compared on one plot.
from __future__ import annotations

import matplotlib.pyplot as plt
import numpy as np

from probly.plot import PlotConfig, plot_credal_set
from probly.representation.credal_set.array import (
    ArrayConvexCredalSet,
    ArrayDiscreteCredalSet,
    ArrayDistanceBasedCredalSet,
    ArrayProbabilityIntervalsCredalSet,
    ArraySingletonCredalSet,
)
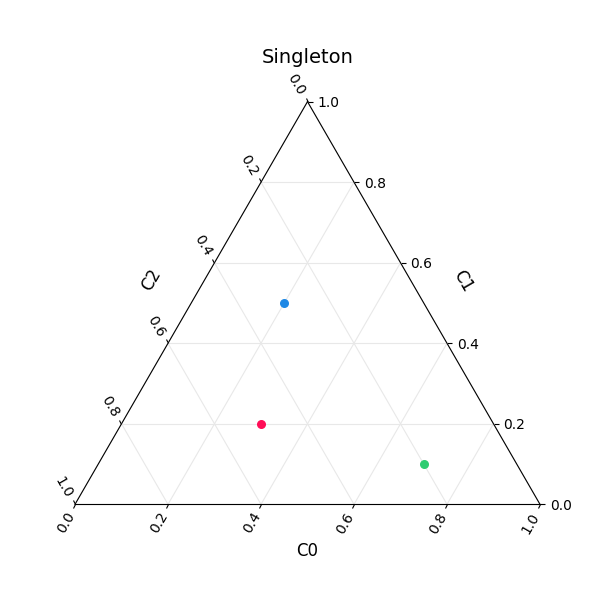
Singleton credal set
The simplest case: each instance is a single probability distribution.
singleton = ArraySingletonCredalSet(
    array=np.array([[0.5, 0.3, 0.2], [0.2, 0.5, 0.3], [0.1, 0.2, 0.7]]),
)
plot_credal_set(singleton, title="Singleton")
plt.show()
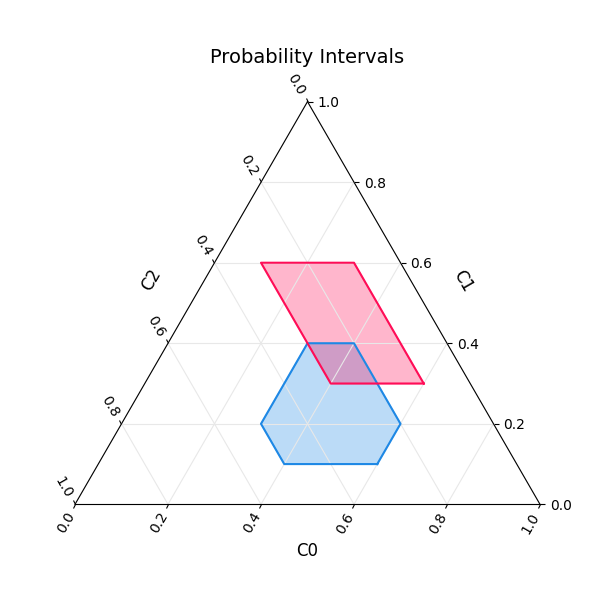
Probability intervals
Each class has independent lower and upper probability bounds. The feasible region on the simplex is the set of all distributions that respect every bound.
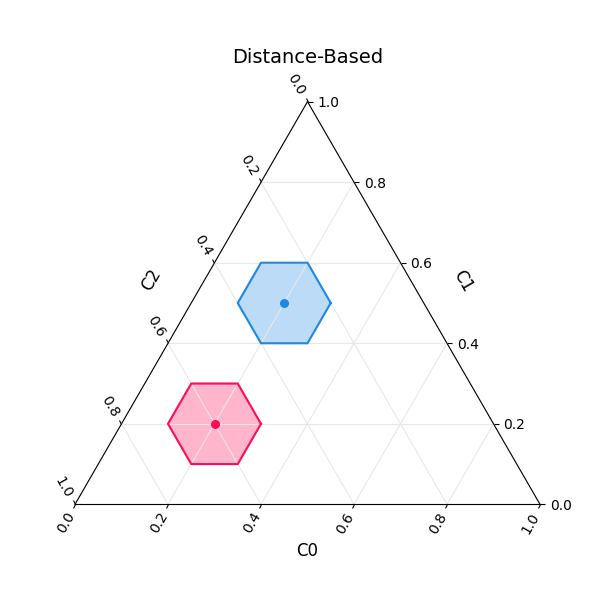
Distance-based credal set
Defined by a nominal distribution and a radius (total-variation distance). The filled polygon shows all distributions within that distance; the marker highlights the nominal.
distance_based = ArrayDistanceBasedCredalSet(
    nominal=np.array([[0.5, 0.3, 0.2], [0.2, 0.6, 0.2]]),
    radius=np.array([0.1, 0.1]),
)
plot_credal_set(distance_based, title="Distance-Based")
plt.show()
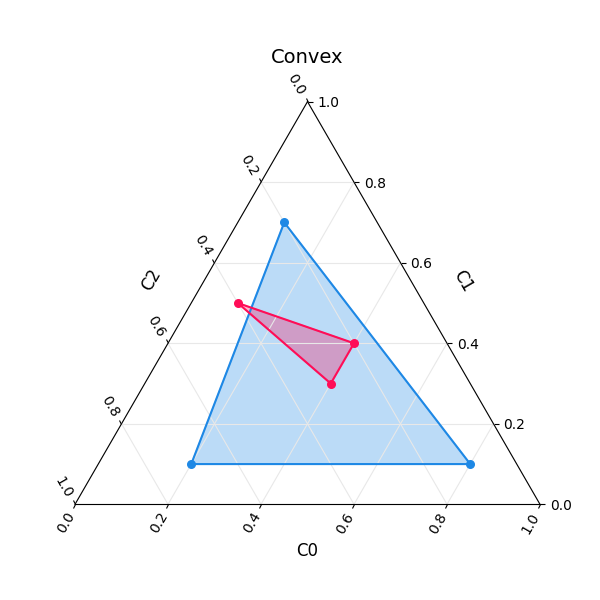
Convex credal set
Given explicitly as a set of vertex distributions. The convex hull is drawn as a filled polygon with markers at each vertex.
convex = ArrayConvexCredalSet(
    array=np.array(
        [
            [[0.7, 0.2, 0.1], [0.1, 0.7, 0.2], [0.1, 0.1, 0.8]],
            [[0.5, 0.4, 0.1], [0.3, 0.3, 0.4], [0.4, 0.2, 0.4]],
        ]
    ),
)
plot_credal_set(convex, title="Convex")
plt.show()
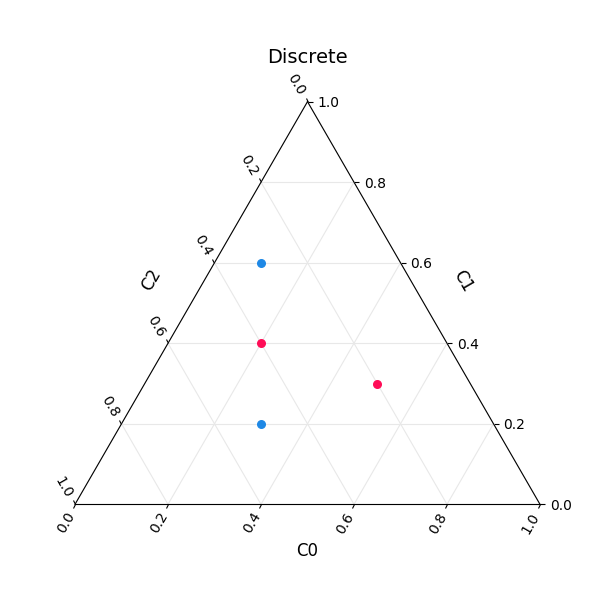
Discrete credal set
Identical representation to the convex case but semantically represents a finite set of distributions rather than their convex hull.
discrete = ArrayDiscreteCredalSet(
    array=np.array(
        [
            [[0.6, 0.3, 0.1], [0.2, 0.5, 0.3]],
            [[0.4, 0.4, 0.2], [0.3, 0.2, 0.5]],
        ]
    ),
)
plot_credal_set(discrete, title="Discrete")
plt.show()
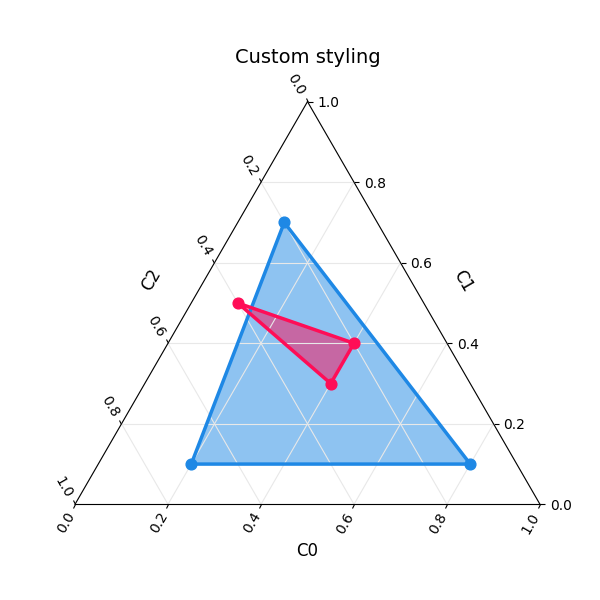
Custom configuration
Pass a PlotConfig to adjust colours, line widths, or
other styling parameters.
Total running time of the script: (0 minutes 1.732 seconds)