Note
Go to the end to download the full example code.
Plotting credal sets on a spider (radar) chart
The plot_credal_set() function automatically switches to a
spider (radar) plot for credal sets with 4 or more classes. Each class
corresponds to a spoke, and probability bounds are rendered as constant-width
bars.
The same five credal set types are supported:
ArraySingletonCredalSet– a closed envelope connecting point probabilities on each spoke.ArrayProbabilityIntervalsCredalSet– constant-width bars on each spoke from lower to upper bound.ArrayDistanceBasedCredalSet– the same bars plus a marker at the nominal distribution.ArrayConvexCredalSet– member distribution lines with a filled min/max envelope.ArrayDiscreteCredalSet– individual member distributions as distinct colored lines.
An optional ground_truth overlay (as an ArraySingletonCredalSet)
can be added to any plot type.
from __future__ import annotations

import matplotlib.pyplot as plt
import numpy as np

from probly.plot import PlotConfig, plot_credal_set
from probly.representation.credal_set.array import (
    ArrayConvexCredalSet,
    ArrayDiscreteCredalSet,
    ArrayDistanceBasedCredalSet,
    ArrayProbabilityIntervalsCredalSet,
    ArraySingletonCredalSet,
)

NUM_CLASSES = 8
CLASS_LABELS = [f"Class {i}" for i in range(NUM_CLASSES)]
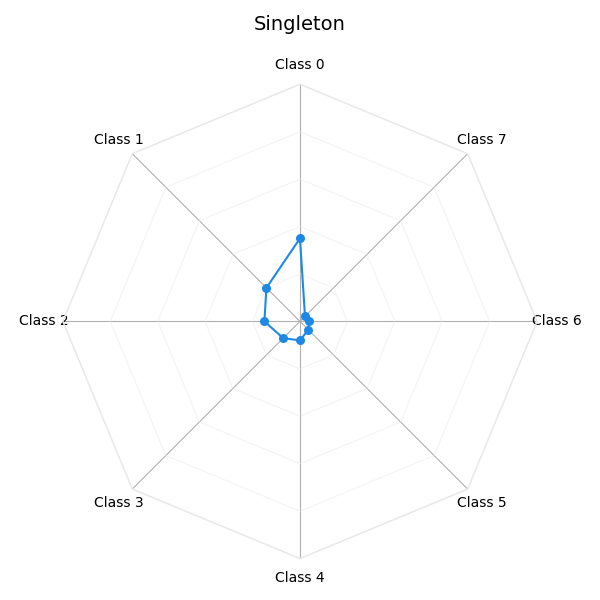
Singleton credal set
A single probability distribution shown as a closed envelope.
singleton = ArraySingletonCredalSet(
    array=np.array([[0.35, 0.20, 0.15, 0.10, 0.08, 0.05, 0.04, 0.03]]),
)
plot_credal_set(singleton, title="Singleton", labels=CLASS_LABELS)
plt.show()
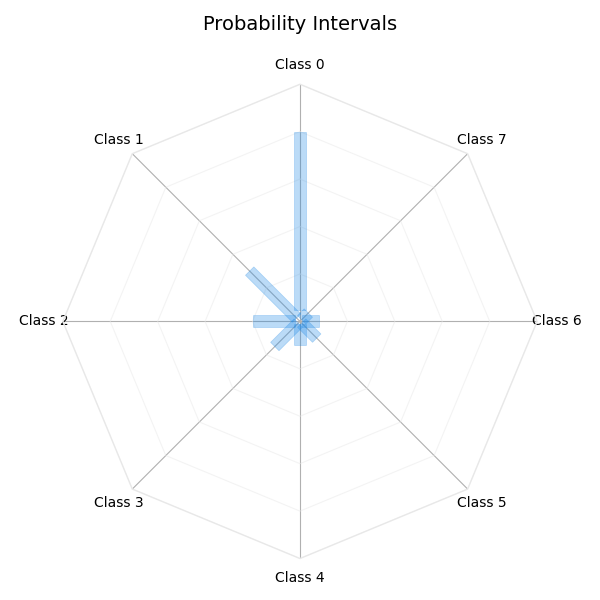
Probability intervals
Constant-width bars show the per-class probability bounds.
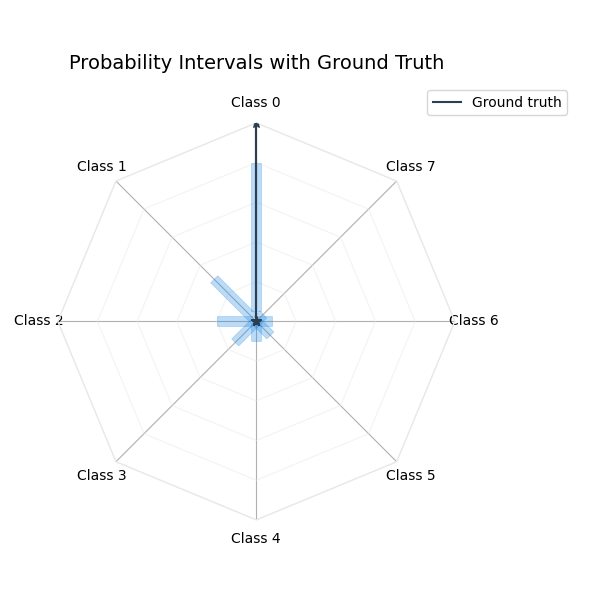
Probability intervals with ground-truth overlay
A ground-truth overlay is shown as a star marker.
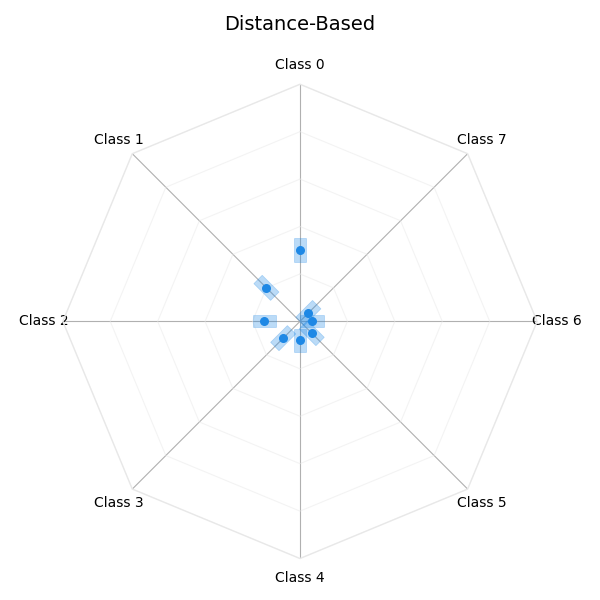
Distance-based credal set
Interval bars derived from a nominal distribution and radius, with a marker at the nominal.
distance_based = ArrayDistanceBasedCredalSet(
    nominal=np.array([[0.30, 0.20, 0.15, 0.10, 0.08, 0.07, 0.05, 0.05]]),
    radius=np.array([0.05]),
)
plot_credal_set(distance_based, title="Distance-Based", labels=CLASS_LABELS)
plt.show()
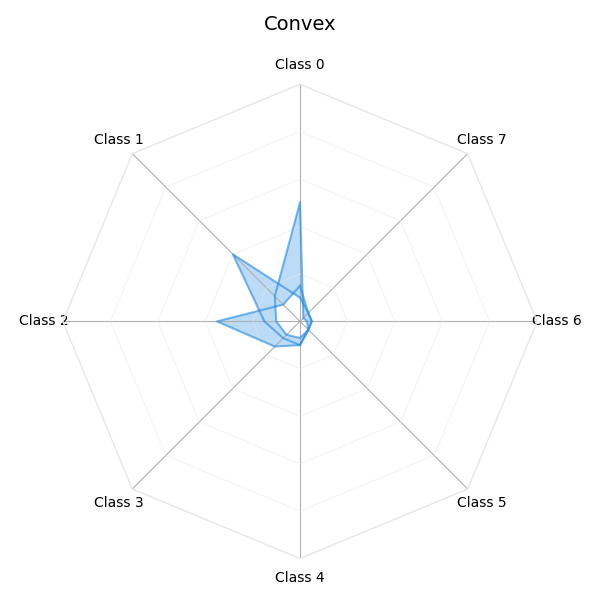
Convex credal set
Multiple vertex distributions drawn as prominent lines with a filled min/max envelope.
convex = ArrayConvexCredalSet(
    array=np.array([
        [
            [0.50, 0.15, 0.10, 0.08, 0.07, 0.05, 0.03, 0.02],
            [0.10, 0.40, 0.15, 0.10, 0.10, 0.05, 0.05, 0.05],
            [0.15, 0.10, 0.35, 0.15, 0.10, 0.05, 0.05, 0.05],
        ],
    ]),
)
plot_credal_set(convex, title="Convex", labels=CLASS_LABELS)
plt.show()
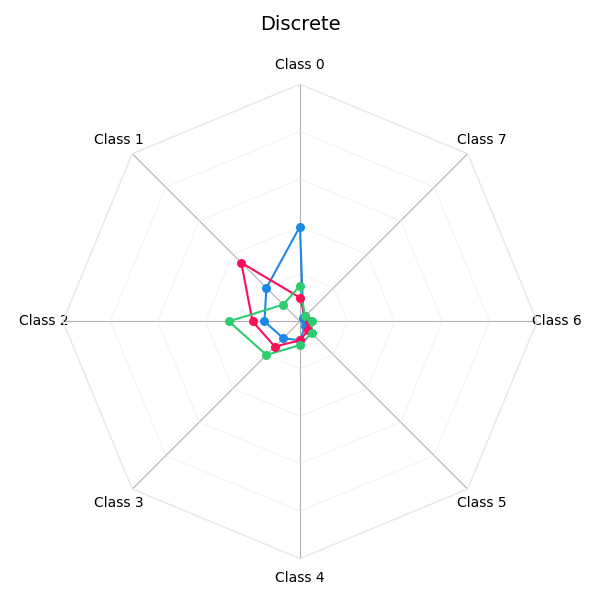
Discrete credal set
Each member distribution is drawn as its own colored line.
discrete = ArrayDiscreteCredalSet(
    array=np.array([
        [
            [0.40, 0.20, 0.15, 0.10, 0.08, 0.03, 0.02, 0.02],
            [0.10, 0.35, 0.20, 0.15, 0.08, 0.05, 0.04, 0.03],
            [0.15, 0.10, 0.30, 0.20, 0.10, 0.07, 0.05, 0.03],
        ],
    ]),
)
plot_credal_set(discrete, title="Discrete", labels=CLASS_LABELS)
plt.show()
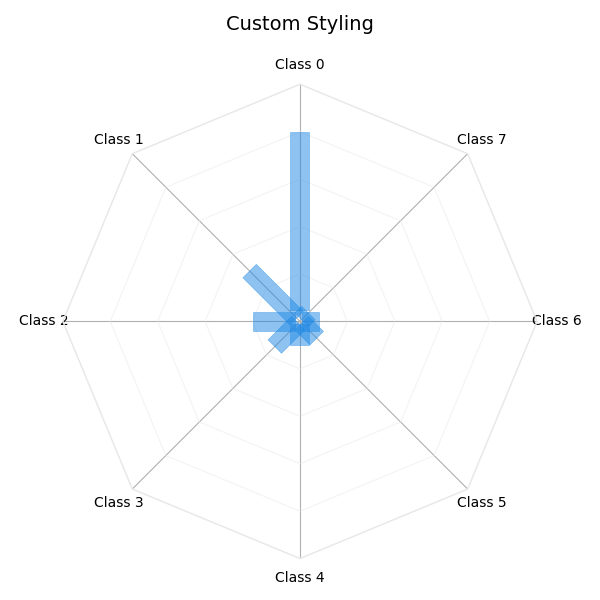
Custom styling
Adjust visual parameters through PlotConfig.
Total running time of the script: (0 minutes 0.589 seconds)