Note
Go to the end to download the full example code.
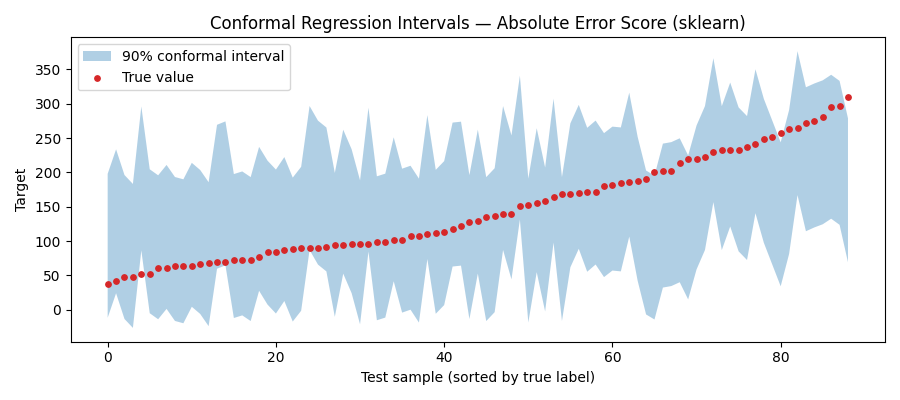
Regression Conformal Prediction — sklearn
Demonstrate absolute_error_score()
using a DecisionTreeRegressor on the Diabetes dataset.
The conformal interval for a new point \(x\) is
\[\hat{f}(x) \pm \hat{q}_{1-\alpha}\]
where \(\hat{q}_{1-\alpha}\) is the empirical \((1-\alpha)\)-quantile of the absolute residuals on the calibration set.
from __future__ import annotations

import matplotlib.pyplot as plt
import numpy as np
from sklearn.datasets import load_diabetes
from sklearn.ensemble import RandomForestRegressor
from sklearn.model_selection import KFold, train_test_split

from probly.calibrator import calibrate
from probly.evaluation import coverage, efficiency
from probly.method.conformal import conformal_absolute_error
from probly.representer import representer
Data preparation
Build and train the model
model = RandomForestRegressor(random_state=42)
model.fit(X_train, y_train)
Absolute error score
Absolute Error — coverage: 0.955, avg interval size: 209.7
Visualise prediction intervals
Sort by true label for a cleaner plot.
intervals = output.array  # (n_test, 2): [lower, upper]
order = np.argsort(y_test)

plt.figure(figsize=(9, 4))
plt.fill_between(
    range(len(y_test)),
    intervals[order, 0],
    intervals[order, 1],
    alpha=0.35,
    label="90% conformal interval",
)
plt.scatter(range(len(y_test)), y_test[order], s=15, color="tab:red", label="True value", zorder=3)
plt.xlabel("Test sample (sorted by true label)")
plt.ylabel("Target")
plt.title("Conformal Regression Intervals — Absolute Error Score (sklearn)")
plt.legend()
plt.tight_layout()
plt.show()
Summary (Averaged over multiple runs)
res = {"Absolute Error": []}
for fold, (train_idx, test_idx) in enumerate(KFold(n_splits=5, shuffle=True, random_state=42).split(X)):
    X_train, y_train = X[train_idx], y[train_idx]
    X_test, y_test = X[test_idx], y[test_idx]
    X_train, X_calib, y_train, y_calib = train_test_split(X_train, y_train, test_size=0.25, random_state=fold)

    fold_model = RandomForestRegressor(max_depth=3, random_state=fold)
    fold_model.fit(X_train, y_train)
    calibrated_model = calibrate(conformal_absolute_error(fold_model), 0.05, y_calib, X_calib)
    output = representer(calibrated_model).predict(X_test)
    cov = coverage(output, y_test)
    size = efficiency(output)
    res["Absolute Error"].append((cov, size))

for name, vals in res.items():
    covs, sizes = zip(*vals)
    print(f"{name} — coverage: {np.mean(covs):.3f} ± {np.std(covs):.3f}, avg interval size: {np.mean(sizes):.1f} ± {np.std(sizes):.1f}")
Absolute Error — coverage: 0.959 ± 0.027, avg interval size: 238.1 ± 15.4
Total running time of the script: (0 minutes 0.824 seconds)