Note
Go to the end to download the full example code.
Uncertainty Quantification.
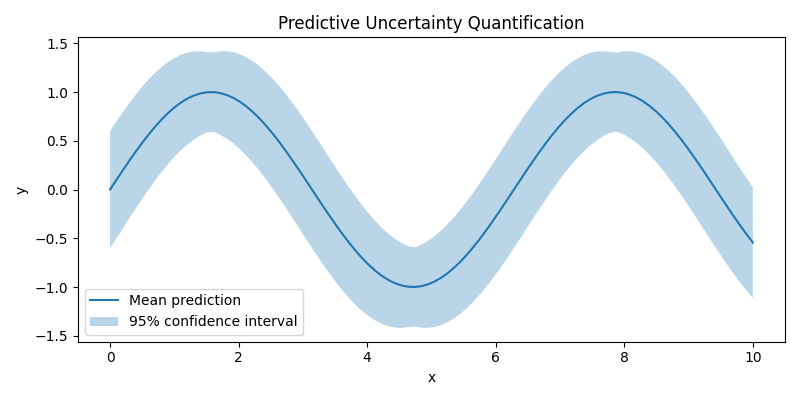
This example demonstrates a simple form of uncertainty quantification (UQ) for a regression-like setting.
We simulate a predictive distribution by sampling multiple model predictions (e.g., think “ensemble” predictions). From these samples we compute:
Predictive mean
Predictive standard deviation
An uncertainty band (mean +/- 2 std)
from __future__ import annotations

import matplotlib.pyplot as plt
import numpy as np

# Data
X = np.linspace(0, 10, 100)
y_mean = np.sin(X)
y_std = 0.2 + 0.1 * np.abs(np.cos(X))

# Confidence interval
upper = y_mean + 2 * y_std
lower = y_mean - 2 * y_std

# Plot
plt.figure(figsize=(8, 4))
plt.plot(X, y_mean, label="Mean prediction")
plt.fill_between(X, lower, upper, alpha=0.3, label="95% confidence interval")

plt.legend()
plt.title("Predictive Uncertainty Quantification")
plt.xlabel("x")
plt.ylabel("y")
plt.tight_layout()
plt.show()
Total running time of the script: (0 minutes 0.100 seconds)