Note
Go to the end to download the full example code.
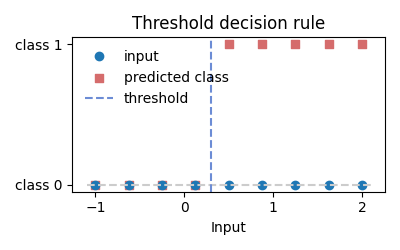
Threshold-based decision sketch.
A minimal thresholding “predictor” that turns continuous inputs into class labels, plus a plot showing how the decision changes with the threshold.
from __future__ import annotations

import matplotlib.pyplot as plt
import numpy as np


def threshold_predict(x: np.ndarray, threshold: float) -> np.ndarray:
    """Return 1 for values above the threshold, otherwise 0."""
    return (x > threshold).astype(int)


x = np.linspace(-1.0, 2.0, 9)
threshold = 0.3
preds = threshold_predict(x, threshold)

plt.figure(figsize=(4, 2.5))
plt.plot(x, np.zeros_like(x), "o", label="input")
plt.hlines(0, x.min() - 0.1, x.max() + 0.1, colors="#cccccc", linestyles="--")
plt.scatter(x, preds, color="#d56c6c", marker="s", label="predicted class")
plt.axvline(threshold, color="#6c8cd5", linestyle="--", label="threshold")
plt.xlabel("Input")
plt.yticks([0, 1], ["class 0", "class 1"])
plt.title("Threshold decision rule")
plt.legend(loc="upper left", frameon=False)
plt.tight_layout()
Total running time of the script: (0 minutes 0.057 seconds)